I-Projection Results

Steven

2025-11-19

Q1.) Do projections move closer to the positive end of the axis over time?

Note. Data are aggregated at the assessment level and coefficients are unstandardized.First person sing. = means of I, me, and my projections for each participant.

first_person_sing_valence_combined

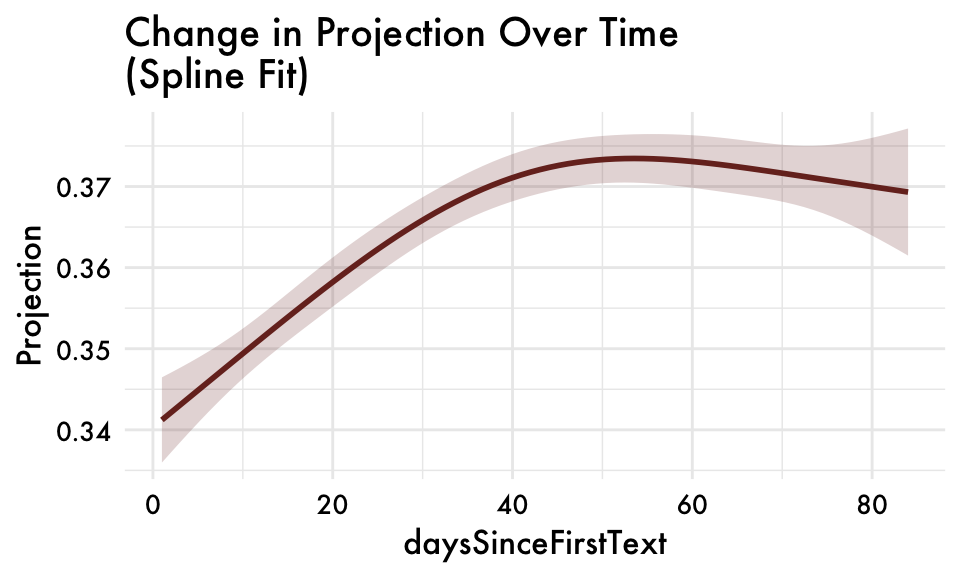
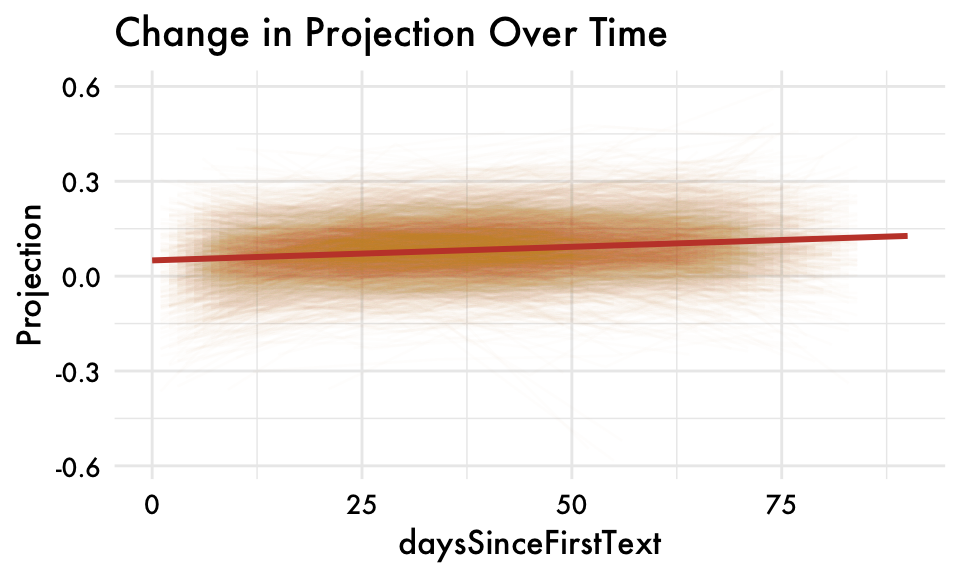
first_person_sing_valence_combined individual variation

first_person_sing_valence_combined spline fit

First-person sing. able projections (am, feel, & combined)

Note. Data are aggregated at the assessment level and coefficients are unstandardized.First person sing. = means of I, me, and my projections for each participant.

first_person_sing_ability_combined

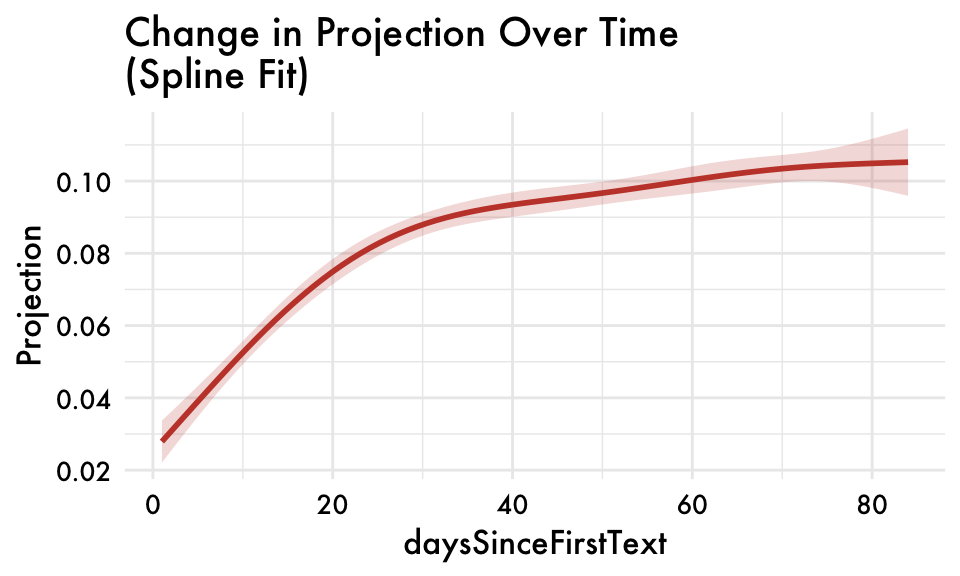
first_person_sing_ability_combined individual variation

first_person_sing_ability_combined spline fit

Q2.) Do our projection measures predict changes in internalizing symptoms over time?

Results are condensed to be for the first-person singular valence and ability projections only (combined).

Valence Projection

Ability Projection

Q3.) Are these predictions robust to other linguisitic features?

Results are condensed to be for the first-person singular valence and ability projections only (combined).

Valence Projections

Ability Projections

Q4.) Can we cluster based on projection scores?

Good-bad

Map Change over time in each cluster

# Standardization method: pseudo

Parameter          | Std. Coef. |       95% CI
----------------------------------------------
(Intercept)        |       0.00 | [0.00, 0.00]
daysSinceFirstText |       0.06 | [0.05, 0.06]
# Standardization method: pseudo

Parameter          | Std. Coef. |       95% CI
----------------------------------------------
(Intercept)        |       0.00 | [0.00, 0.00]
daysSinceFirstText |       0.07 | [0.06, 0.08]
# Standardization method: pseudo

Parameter          | Std. Coef. |        95% CI
-----------------------------------------------
(Intercept)        |       0.00 | [ 0.00, 0.00]
daysSinceFirstText |  -3.67e-03 | [-0.01, 0.00]
# Standardization method: pseudo

Parameter          | Std. Coef. |         95% CI
------------------------------------------------
(Intercept)        |       0.00 | [ 0.00,  0.00]
daysSinceFirstText |      -0.02 | [-0.03, -0.02]

Differences in Symptoms Across Clusters


Controlling for baseline symptoms

Plot

Do clusters moderate?

model = lmer(Internalizing ~ first_person_sing_valence_combined * clusterComb + daysSinceFirstText + (1|room_id), data = data_cluster)

Table

Plot

All plots together

Able-Unable

Map Change over time in each cluster

# Standardization method: pseudo

Parameter          | Std. Coef. |       95% CI
----------------------------------------------
(Intercept)        |       0.00 | [0.00, 0.00]
daysSinceFirstText |       0.10 | [0.08, 0.11]
# Standardization method: pseudo

Parameter          | Std. Coef. |       95% CI
----------------------------------------------
(Intercept)        |       0.00 | [0.00, 0.00]
daysSinceFirstText |       0.06 | [0.06, 0.07]
# Standardization method: pseudo

Parameter          | Std. Coef. |       95% CI
----------------------------------------------
(Intercept)        |       0.00 | [0.00, 0.00]
daysSinceFirstText |       0.06 | [0.05, 0.06]
# Standardization method: pseudo

Parameter          | Std. Coef. |         95% CI
------------------------------------------------
(Intercept)        |       0.00 | [ 0.00,  0.00]
daysSinceFirstText |       0.07 | [ 0.06,  0.08]

Differences in Symptoms Across Clusters


Cluster predicting fdSx controlling for bSx

Plot

Do clusters moderate?

Table

Plot

All plots together

Q5) Is this occurring for all words, or is ā€œIā€ unique in some way?

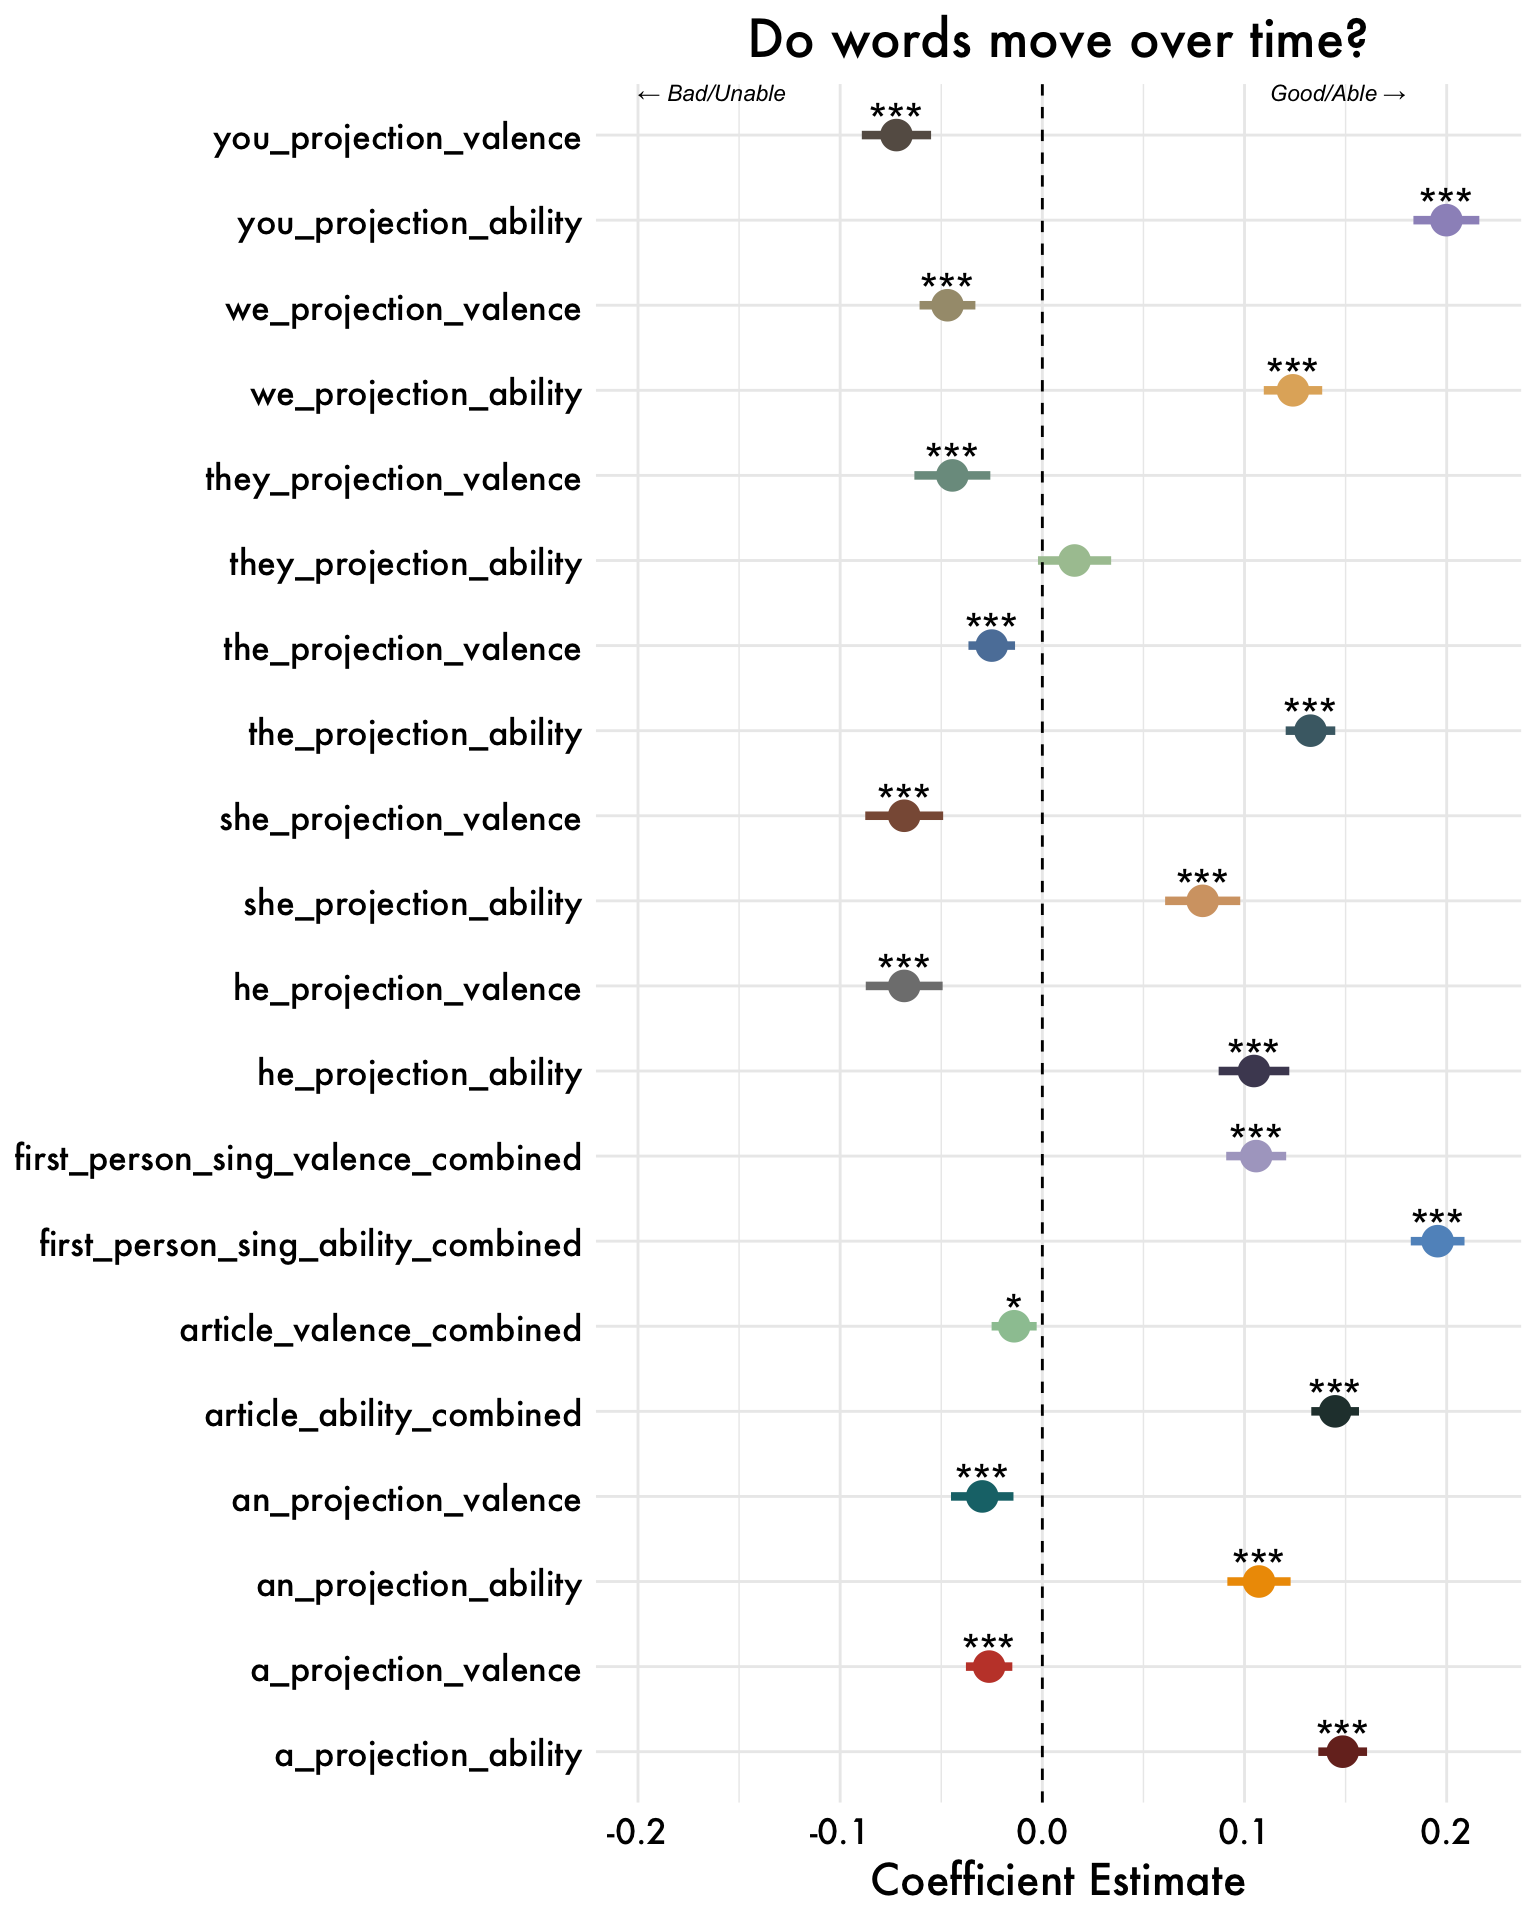
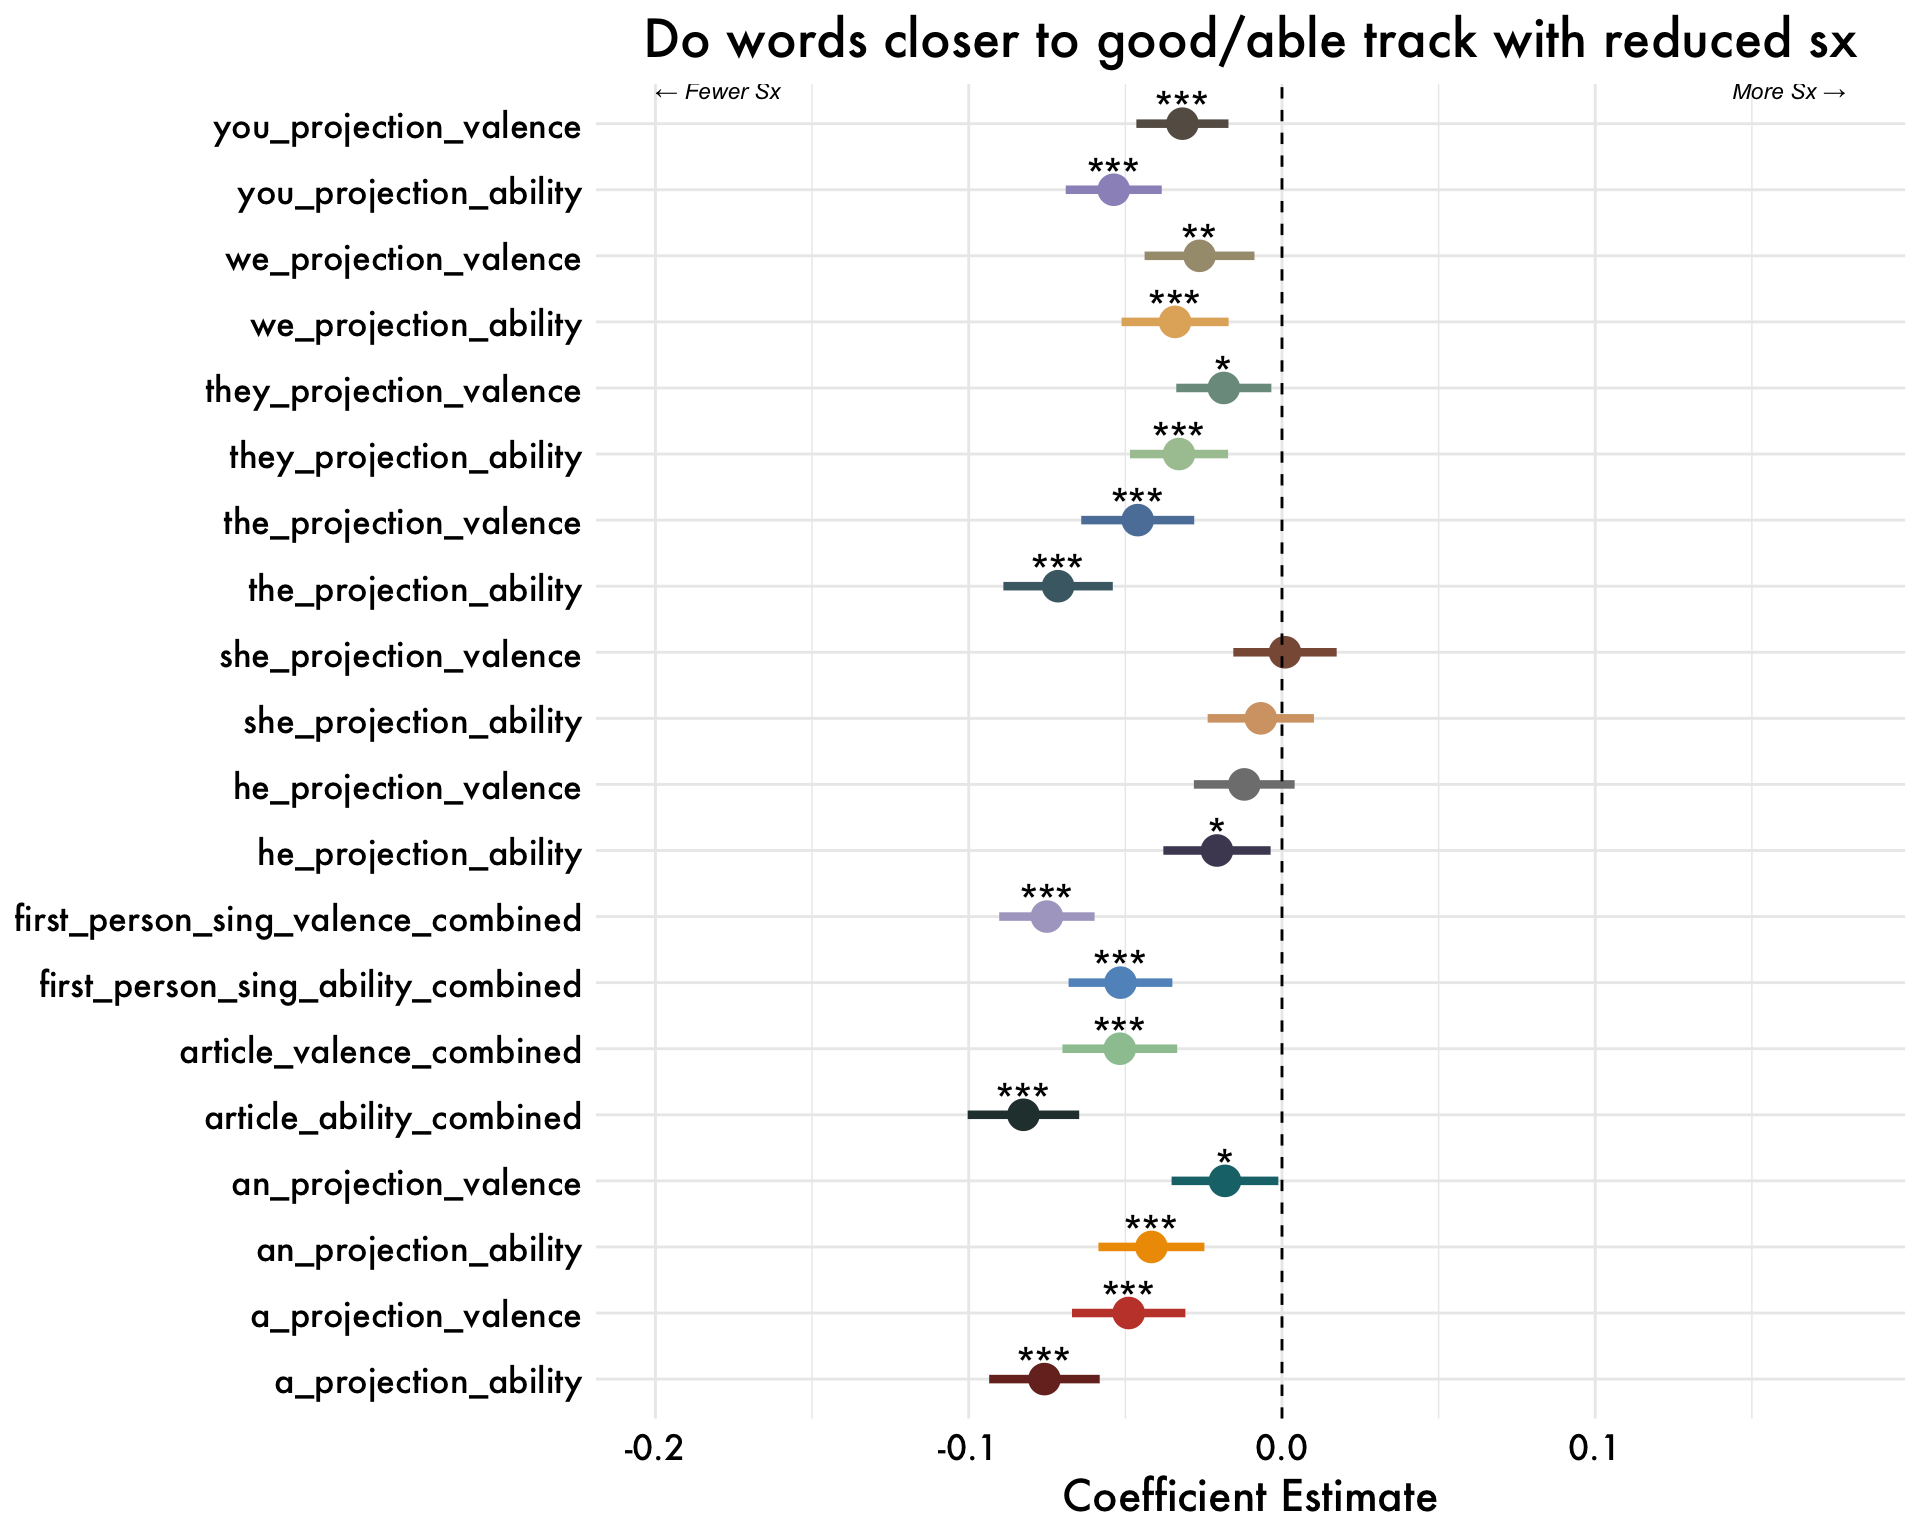
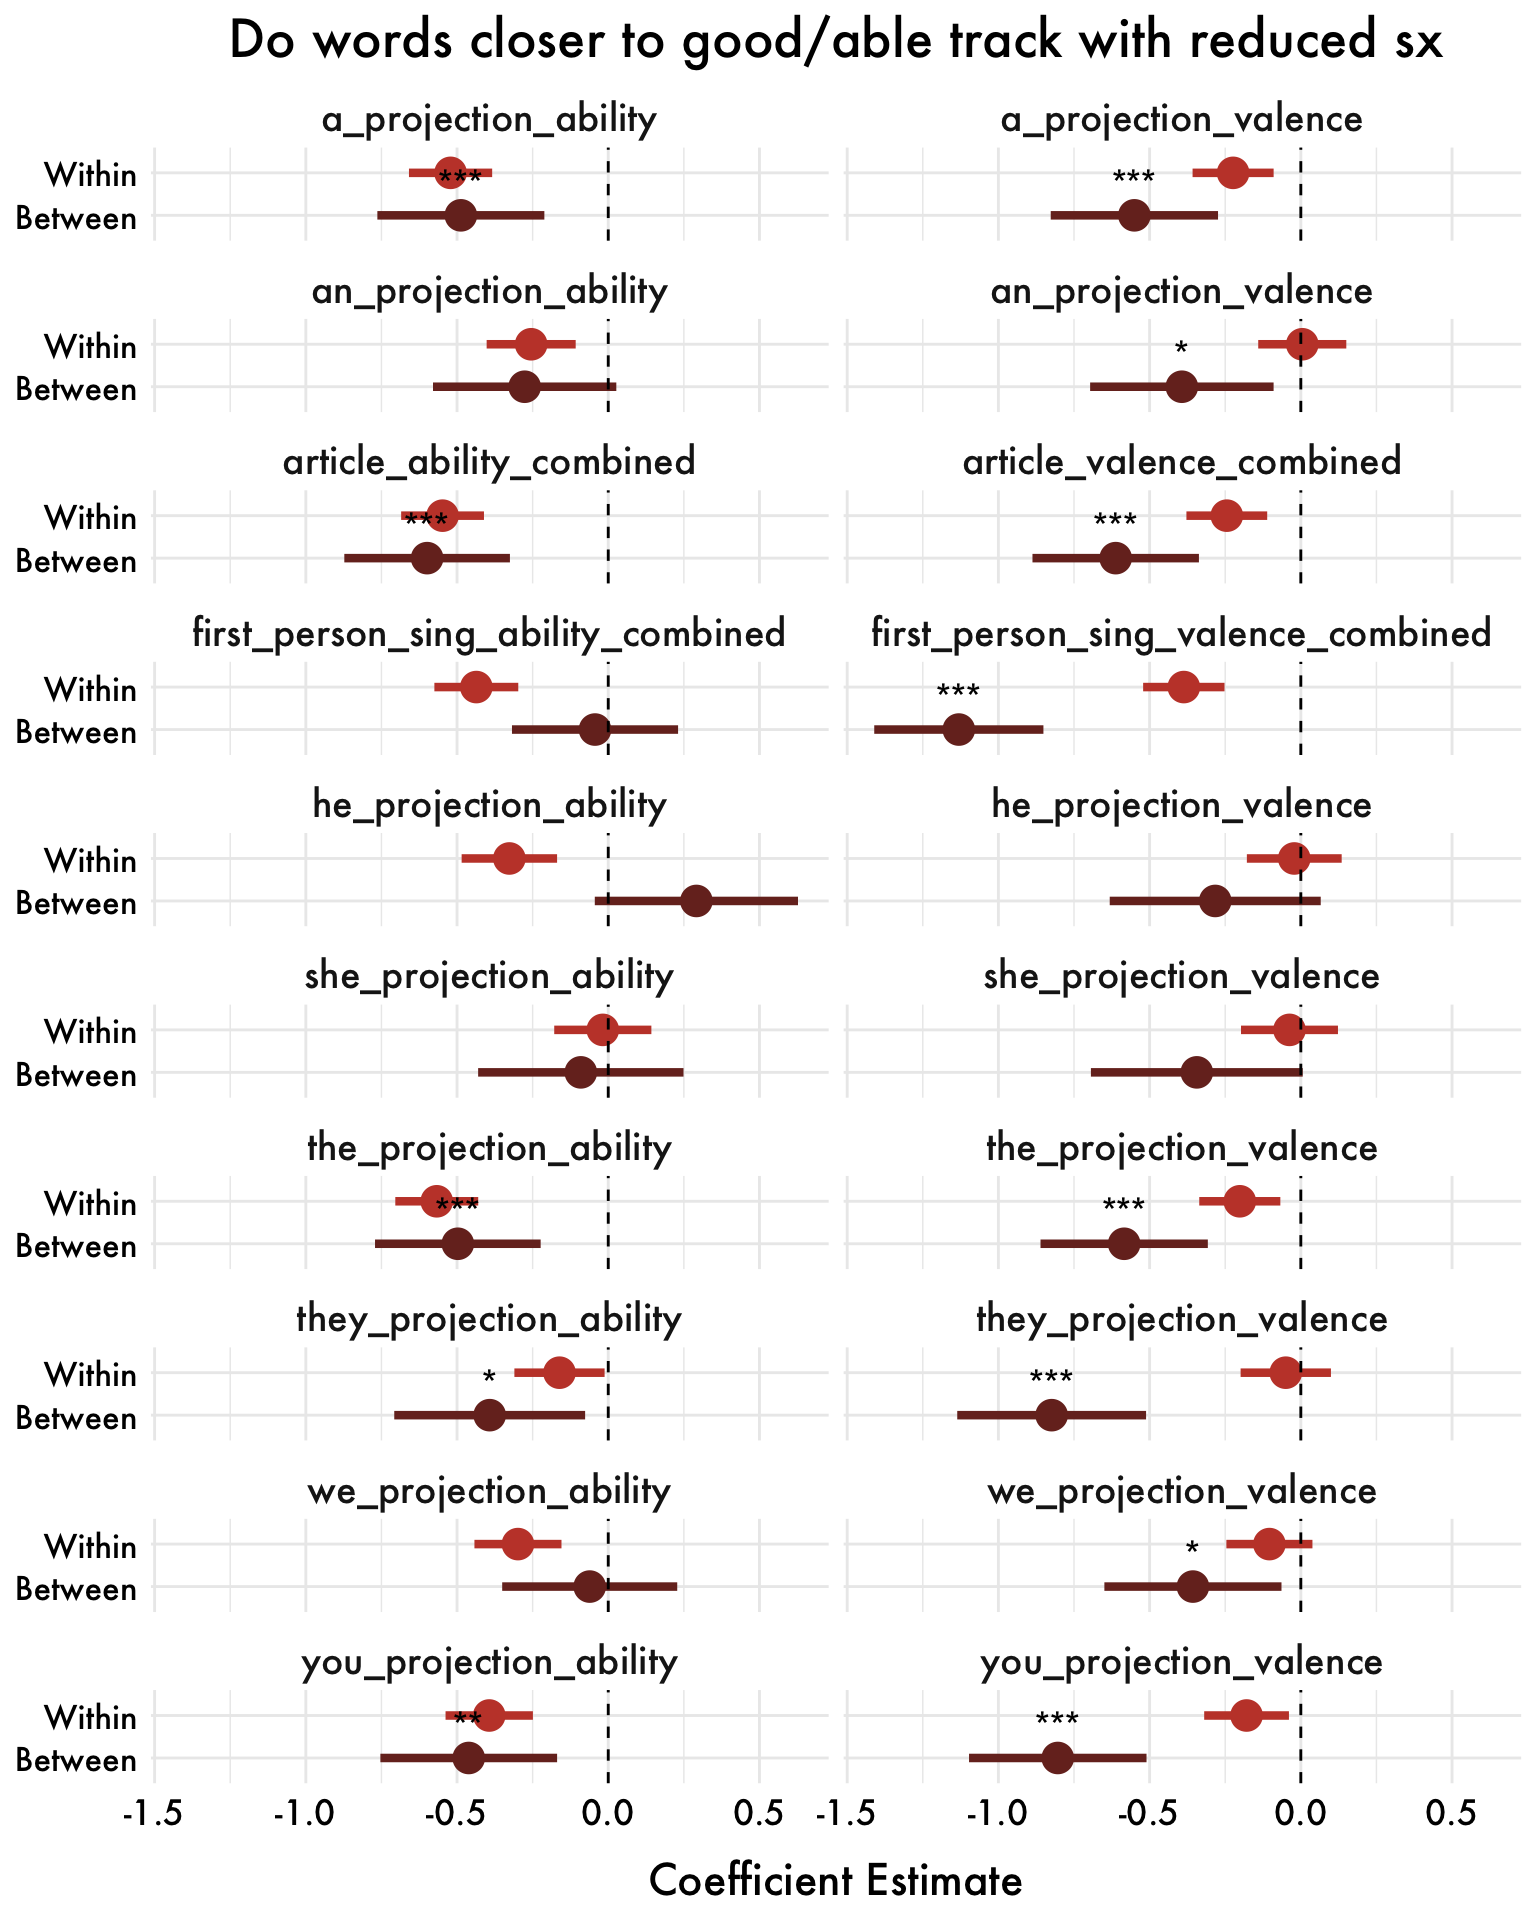
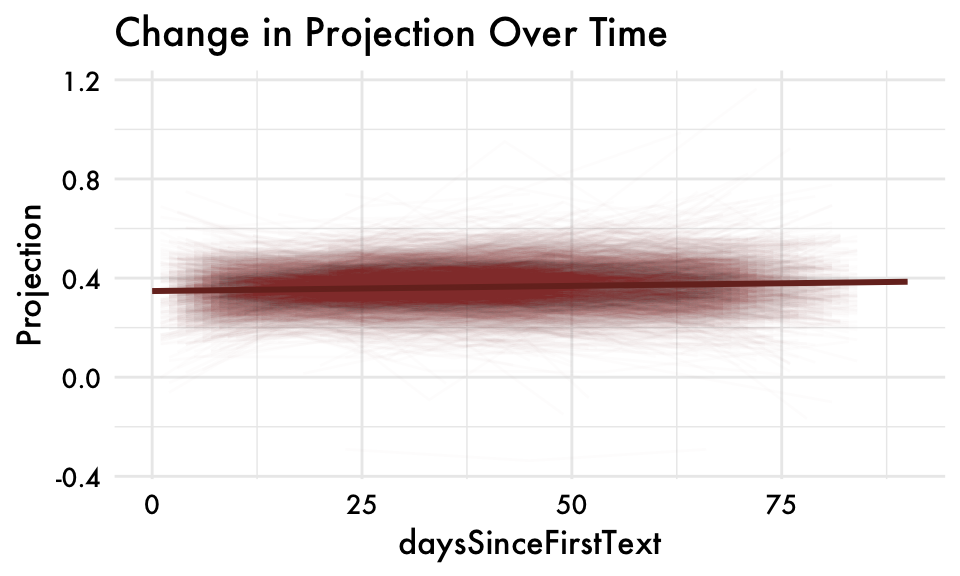
Changes in Meaning over Time

Track with Changes in Symptoms